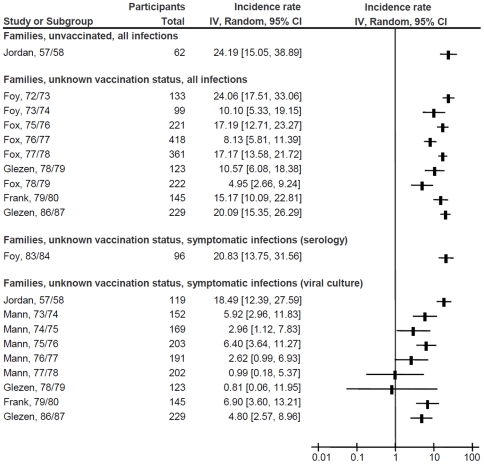
Figure 3. Forest plot of influenza incidence rates in adults sharing their households with children.
Squares and horizontal lines through the squares represent incidence rates with 95% confidence intervals. Abbreviations: IV, inverse variance; CI, confidence interval; PCR, polymerase chain reaction.

