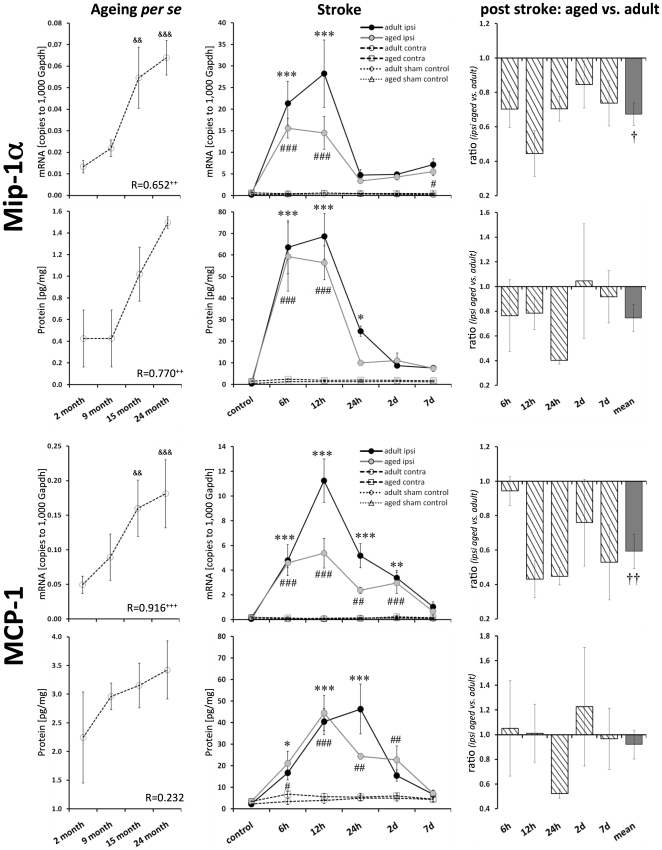
Figure 4. Age- and stroke-dependent expression of Mip-1α and MCP-1.
Mip-1α and MCP-1 displayed significantly elevated expression levels with age. Mip-1α and MCP-1 transcript and protein expression increased significantly following stroke. This up-regulation was attenuated in aged brains. Expression values are shown as mean ± SEM and ratios as geometric mean ± SEM. For details of the statistical analysis, see Figure 2's legend or the Materials and Methods section.

