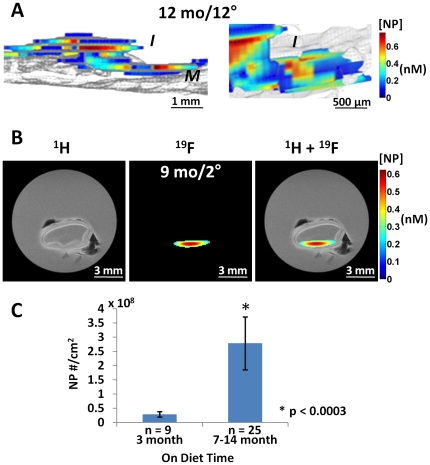
Figure 3. MRI imaging and quantification of NP signal in cholesterol plaques.
A: Left: 3D saggital rendering of nanoparticle signals from aorta of 12 mo cholesterol fed rabbit after 12 hours circulation time in vivo. 19F MR image registering nanoparticle fluorine cores (color) overlaid on 1H MR image (gray) of aorta show intimal (I) location of particles trapped in thickened plaque (color) atop the medial (M) layer (gray). Particle concentration per voxel is coded in nM (scale bar). Right: Close up of intimal layer. B: 1H, 19F and overlay MR transverse images of aortic rings with nanoparticles trapped in intima of thickened plaque from 9 mo cholesterol fed rabbit after 2 hour circulation in vivo. Black artifacts are small air bubbles. Note lack of 19F signal from more normal adjacent tissue sections. C: Comparison of normalized CE NP number to the endothelial surface area between 3 month diet and >7 month diet rabbit aorta samples showing 10 fold greater accumulation in older plaques.

