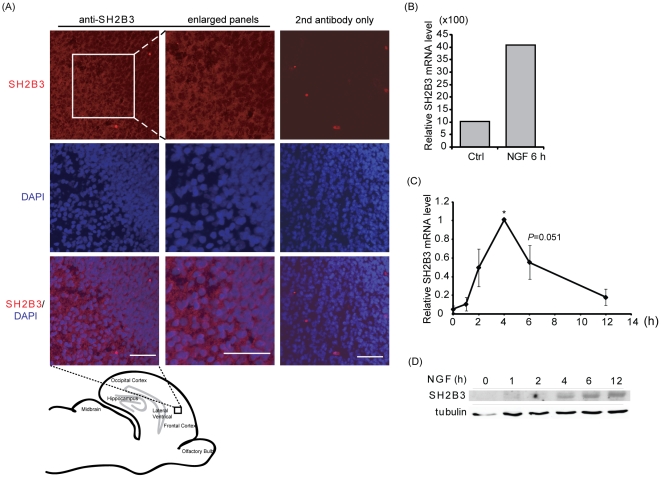
Figure 1. Expression of SH2B3 in the E18 rat brain cortex and in PC12 cells.
(A) Brain slices of E18 rats were subjected to immunofluorescence staining using anti-SH2B3 antibody followed by Alexa Fluor 555-conjugated secondary antibody (shown in red). Enlarged panels from the square box area are shown in the middle column. Secondary antibody controls (without primary antibody) are shown in the panels on the right column. DAPI staining in blue shows the localization of the nucleus. Images were taken using Zeiss LSM 510. Scale bar: 50 µm. (B) Microarray results generated from rat affymetrix chips. Relative mRNA expressions of SH2B3 in PC12-GFP cells treated without (Ctrl) or with 100 ng/ml NGF for 6 h are shown. (C) Relative mRNA expressions of SH2B3 in PC12 cells treated with NGF 50 ng/ml for the indicated time periods were analyzed using Q-PCR. The relative SH2B3 levels were normalized to the levels of GADPH. *: P<0.05, paired Student t-test. (D) Protein lysates from PC12 cells treated with NGF 50 ng/ml for indicated time period were immunoblotted using anti-SH2B3 and anti-tubulin antibodies. Tubulin levels were used as loading controls.

