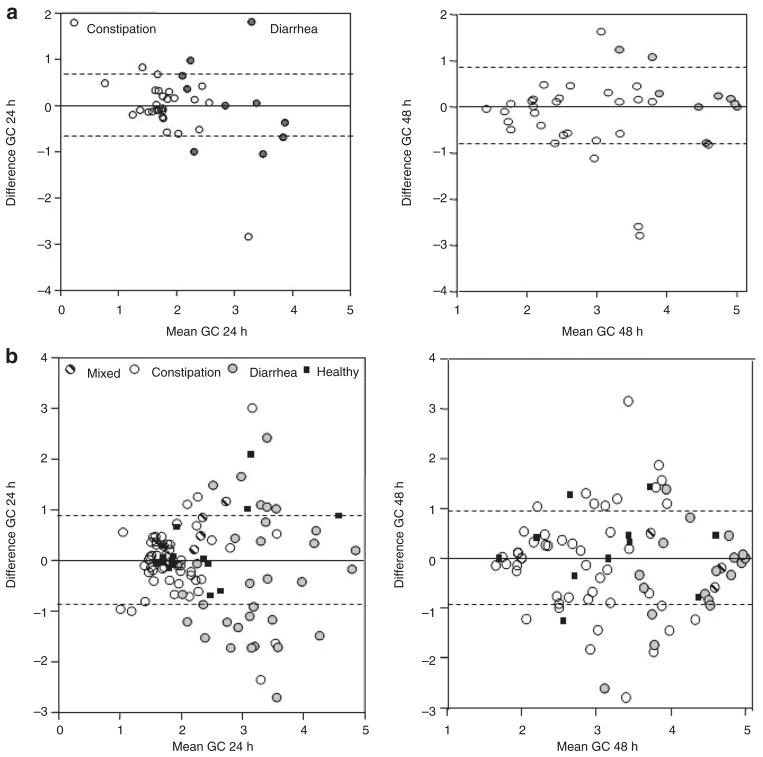
Figure 2.
Intrasubject variation in colonic transit over short- and long term. (a) Bland–Altman plots showing short-term (median 3 weeks) intrasubject variation in colonic transit at 24 and 48 h in IBS patients with diarrhea or constipation. Plot shows 1 SD as interrupted lines. Note that most of the data are well within 1 SD, which is ~0.7 GC units (y axis). Reproduced from ref. 9. (b) Bland–Altman plots showing long-term (median 2 years) intrasubject variation in colonic transit at 24 and 48 h in participants in the various subgroups. The plot shows 1 SD as interrupted lines. Note that most of the data are well within 1 SD, which is ~0.9 GC units (y axis). The greatest variation occurs in IBS patients with diarrhea, and the variation is greater at 24 than at 48 h. Reproduced from ref. 9. GC, geometric center; IBS, irritable bowel syndrome.

