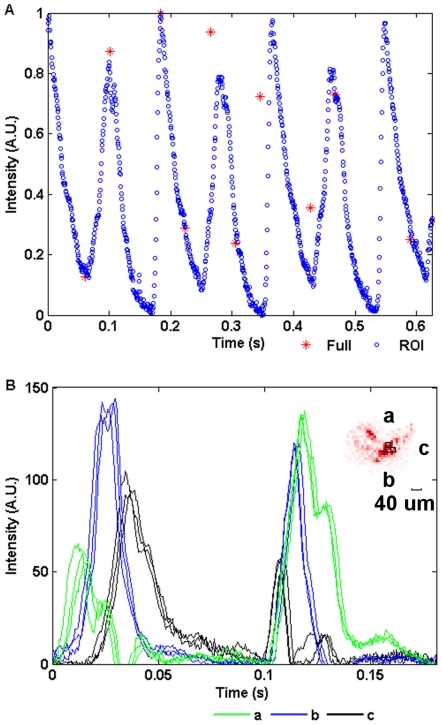
Figure 13. Daphnia's heartbeat.
A) The mean value of each differential frame is plotted for both the full frame (*) and the ROI (o) image sequences. The sampling rate for the full-frame (24.56 fps) is too low to resolve the high-speed transients in the heartbeat but they can be seen clearly at 1572 fps. Note that the differential images show movement in the sample so each heartbeat results in a pair of spikes in this plot. The heart rate of the Daphnia is, therefore, approximate 5 Hz. B) The mean values of different regions (a, b and c, labeled in the top right figure of B) of the heart are compared and show the propogation of the wave across the heart muscle. Three continuous cycles of heartbeats have been overlayed in this figure to illustrate the consistency.

