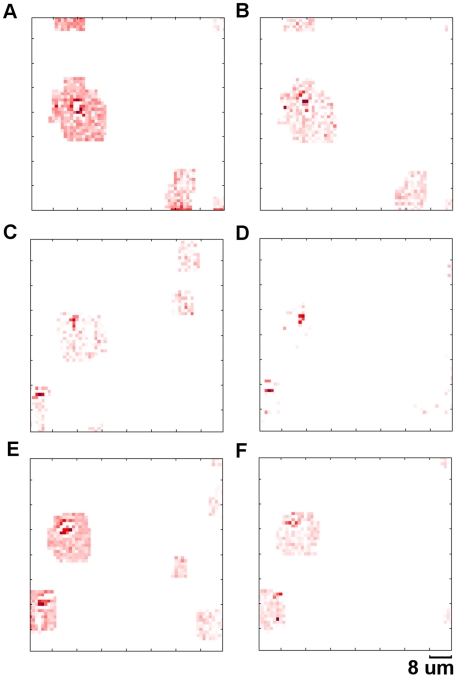
Figure 16. Blood cell flow - high-speed.
Sequence of differential frames showing individual cells flowing along blood vessels in a live Daphnia. These images were acquired in ROI tracking mode at 1572 fps. Frame 1 (A), 101 (B), 201 (C), 301 (D), 401 (E) and 501 (F). The size of the ROI (red region) is 512 pixels. The locations of ROIs (red regions) are continuously updated in this mode to allow the moving blood cells to be tracked. The camera is able to automatically identify and image the second cell when it enters into the field of view (E), (see supplementary material Movie S5).

