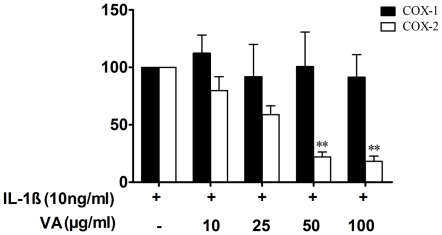
Figure 5. Selective inhibition of COX-2 expression by Viscum album.
Quantitative comparison between expression of COX-1 and COX-2 proteins as revealed by western blot. Protein expression was quantified by densitometry and expressed as percentage protein expression normalized to that in cells stimulated with IL-1β. Results (mean ± SEM) obtained from 3 independent experiments are presented. * P<0.05 versus control cells for COX-2 and ** p<0.05 versus IL-1β-stimulated cells for COX-2 as analyzed by paired Student-t-test. The values for COX-1 are non-significant.

