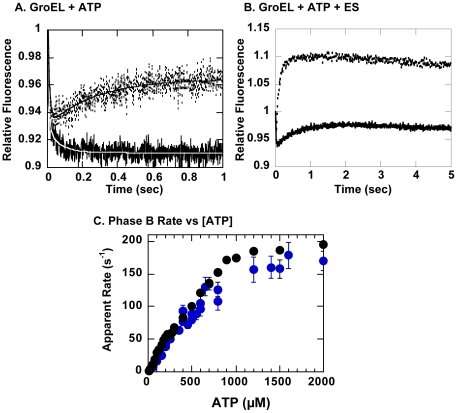
Figure 5. Stopped-flow fluorescence analysis of GroEL R231W and GroEL CP376-RW.
Experiments were performed at 25°C. Solid traces indicate changes in tryptophan fluorescence for CP376-RW and dotted traces indicate fluorescence changes for GroEL R231W. A. Changes triggered by addition of 1 mM ATP, B. changes triggered by addition of 1 mM ATP and an equimolar concentration of GroES heptamer. In A., fits to the raw traces are also shown; in white for CP376-RW and in black for R231W. The kinetic constants derived from the fits are as follows: for CP376-RW; k 1 = 145.8±13.2 s−1, Amp1 = 0.086±0.004, k 2 = 14.2±2.0 s−1, Amp2 = 0.017±0.002. For R231W; k 1 = 116.4±7.9 s−1, Amp1 = 0.076±0.003, k 2 = 2.1±0.15 s−1, Amp2 = −0.037±0.0008. Values are shown as mean ± standard errors. Negative values for amplitude denote phases with increases in fluorescence. C. The changes in the rate constant of Phase B in GroEL CP376-RW as a function of the ATP concentration. Kinetic traces were measured under conditions identical to that for Figure 5A and varying the concentration of ATP during measurement. The traces were analyzed to obtain the value of k (± standard error) at each ATP concentration. The results of two separate experimental sessions are shown (blue filled circles). For comparison, results of a previous identical experiment performed on GroEL R231W [6] is shown in black circles.

