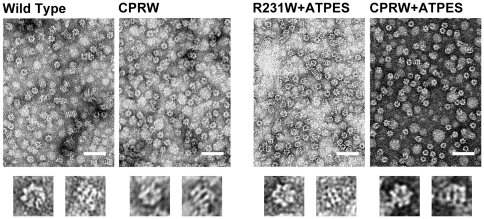
Figure 6. Electron Micrographs of GroEL CP376-RW.
Samples were stained with 1% uranyl acetate. The scale bar in each figure indicates 100 nm. Magnification was x 60,000. Wild Type denotes wild type GroEL, R231W indicates GroEL R231W. CPRW denotes samples of GroEL CP376-RW, and +ATPES indicates samples where 0.2 mM ATP and an equimolar concentration of GroES were added in the course of sample preparation (see Materials and Methods). Below each panel, representative zoomed images of an end-on view (left) and side view (right) particle for each sample are shown.

