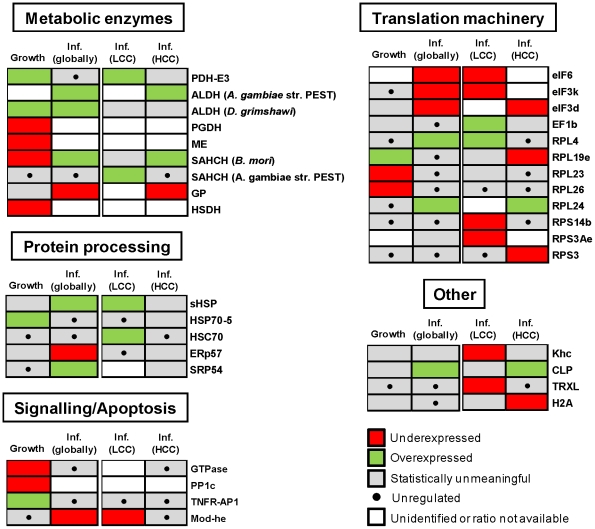
Figure 5. Functional organization of cellular proteins differentially expressed along culture growth and after BV infection.
Under- or over-expression imply statistical significance as described in the text. Proteins suggested to be unregulated locate within Average ± S.D of the respective distributions (cutoff S.D. (ln Rc) = 0.5). Expression ratios, number of peptide hits and protein coverage are shown in Table 1. For detailed statistical information see Tables S2, S3, S4 and S5.

