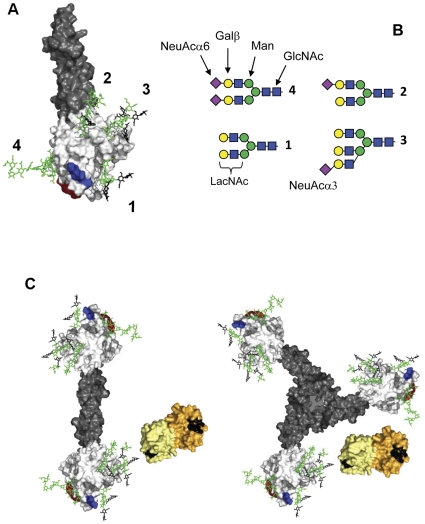
Figure 1. Haptoglobin and galectin-1.
A) A model of one glycoform of haptoglobin (Hp2) with the α-subunit in grey and β-subunit in white, and N-glycans attached at the four known sites (numbers) [2], [3] shown as stick models in green but with the LacNAc parts potentially binding galectin-1 in black. A surface thought to interact with haemoglobin is shown in red and the CD163-binding site is shown in blue [65]. B) Schematics of the N-glycans shown in panel A, with component saccharide moieties indicated. The major N-glycan of human serum is no. 4, a biantennary N-glycan capped with NeuAcα6 (6 bound sialic acid, shown as purple diamonds), which would block galectin binding [20]. The other glycans may lack one or more of the NeuAcα6, and/or have an additional antenna with a NeuAcα3, all of which would open potential galectin-binding sites (see Table S3 in Cederfur et al. [25]). C) Models of dimeric haptoglobin Hp1 and trimeric haptoglobin Hp2, built from the model of panel A, together with two human galectin-1 dimers (pdb-id: 1W6P), colored with the two subunits in different shades of yellow, and the LacNAc-binding site (C–D, [20]) in black. The monosaccharide symbols are as recommended by Consortium for Functional Glycomics (http://glycomics.scripps.edu/CFGnomenclature.pdf): purple diamond, N-acetylneuraminic acid; blue square, N-acetylglucosamine; green ball, mannose; yellow ball, galactose. The coordinates for the model of the haptoglobin peptide chains (panel A) were obtained from the SWISS-MODEL REPOSITORY(http://swissmodel.expasy.org/repository/), Model_id: 76a3bb6963a6b1ee5c09942c719f20c2_UP000020_3, which in turn is built based on the X-ray crystal structure of complement protein C1r (pdb-id: 1GPZ). Four N-glycans with structures as shown in Fig. 1C were attached to the four known N-glycosylation sites of haptoglobin and built into this model and energy minimized using the server GlycamWeb (http://glycam.ccrc.uga.edu/ at Complex Carbohydrate Research Center, The University of Georgia, Athens, GA). The models were visualized using The PyMOL Molecular Graphics System, Version 1.3, Schrödinger, LLC. For the haptoglobin dimer and trimer of panel C, two or three copies of the model of panel A were manually arranged to resemble the models published by Polticelli et al. [1] regarding distances between the β-subunits.

