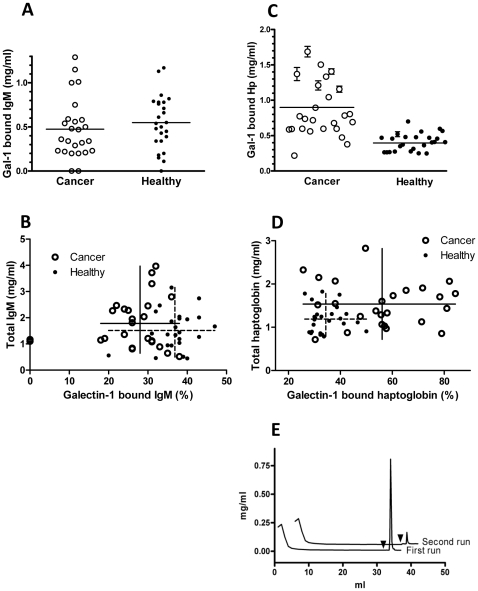
Figure 4. Quantitation of total and galectin-1 bound IgM and haptoglobin in cancer and healthy sera.
A) The concentrations of IgM in the galectin-1 bound fractions from cancer (n = 25) and healthy sera (n = 25) as determined by direct enzyme-linked immunosorbent assay (ELISA). The average for each group is marked by horizontal lines, but the slight difference was statistically not significant (p = 0.41). B) Initial serum levels of IgM (Y-axis) compared to % of galectin-1 bound IgM (X-axis). The averages and ranges of each parameter are shown by crossed lines, unbroken for cancer sera and dashed for healthy sera. The difference between the % galectin-1 bound IgM was significant (p<0.0001) but the difference between total IgM was not (p = 0.24). The three samples with no galectin-1 bound IgM (seen as dots on Y axis) were excluded from the calculation of averages, ranges and significances shown; including them made only a minor change in averages and no change in significance of differences. C) The concentrations of haptoglobin in the galectin-1 bound fractions from cancer (n = 25) and healthy sera (n = 25) as determined by direct ELISA. The average for each group is marked by horizontal lines, and the difference was statistically significant (p<0.0001). Error bars represent SEM from three independent duplicate measurements for each data point. D) Initial serum levels of haptoglobin (Y-axis) compared to % of galectin-1 bound haptoglobin (X-axis). The averages and ranges of each parameter are shown by crossed lines, unbroken for cancer sera and dashed for healthy sera. The difference between the % galectin-1 bound haptoglobin was significant (p<0.0001) and the difference between total haptoglobin was also significant (p = 0.0058). E) Chromatograms of 2 mg purified pooled haptoglobin separated by affinity chromatography on columns (1 ml) with immobilized galectin-1 C3S. The protein concentration of each fraction (0.2 or 1 ml) is given on Y-axis. Elution with lactose (150 mM) started after washing with 32 ml PBS (arrow heads). Non-binding haptoglobin was chromatographed a second time but only traces (∼1%) of additional haptoglobin was now found in the bound fraction. The chromatogram from the second run has been moved for clarity by +0.05 on Y-axis and by +5 on X-axis.

