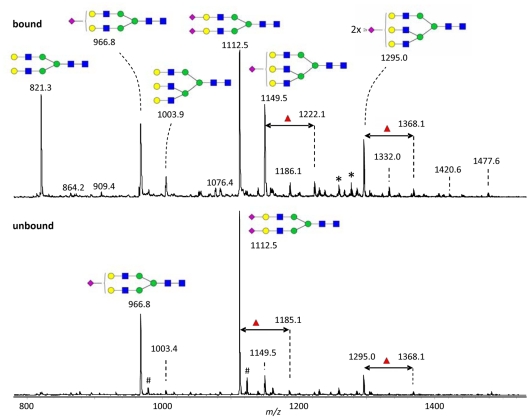
Figure 5. Mass spectrometric analysis of N-glycans from galectin-1 bound and unbound haptoglobin.
Enzymatically released N-glycans from galectin-1 bound (top panel) and unbound (bottom panel) haptoglobin (pooled from human plasma, separated as described in S5) were analyzed by nano-LC-ESI-ion trap-MS. N-glycans were detected in double-protonated form giving m/z values about equal to half the molecular weight. Schematics of the glycans corresponding to the major peaks are shown, with symbols as described for Fig. 1C. Some minor peaks show glycans with an additional fucose residue (red triangle) as indicated by a double-headed arrow. Other minor peaks correspond to tetraantennary glycans with 0, 1 or 2 NeuAc residues (m/z1186.1, 1332.0 and 1477.6, respectively). #, natrium proton mixed adducts; *, single charged contaminants.

