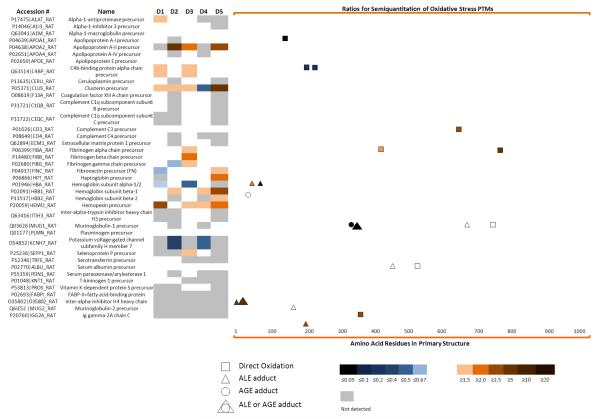
Figure 4.
A heat map of the quantification of the proteins detected and the semiquantitation of their oxidation sites. (Left) The first two columns show the proteins detected. D1-D5 is the fold change of these proteins in the diabetic versus lean controls as quantified by iTRAQ™ labeling. A list of proteins identified and quantified with iTRAQ™ and their corresponding p-values can be found in Table 2.(Right) Fold change at oxidation sites in diabetic rat plasma versus their lean controls. These oxidation sites can be either a product of: direct oxidation, Advanced Lipidperoxidation Endproducts (ALE) adducts or Advanced Glycation Endproducts (AGE) adducts. Methylglyoxal and glyoxal can be considered ALE or AGE. In all cases the color bar describes the intensity level of the proteins (left) or oxidation sites (right)

