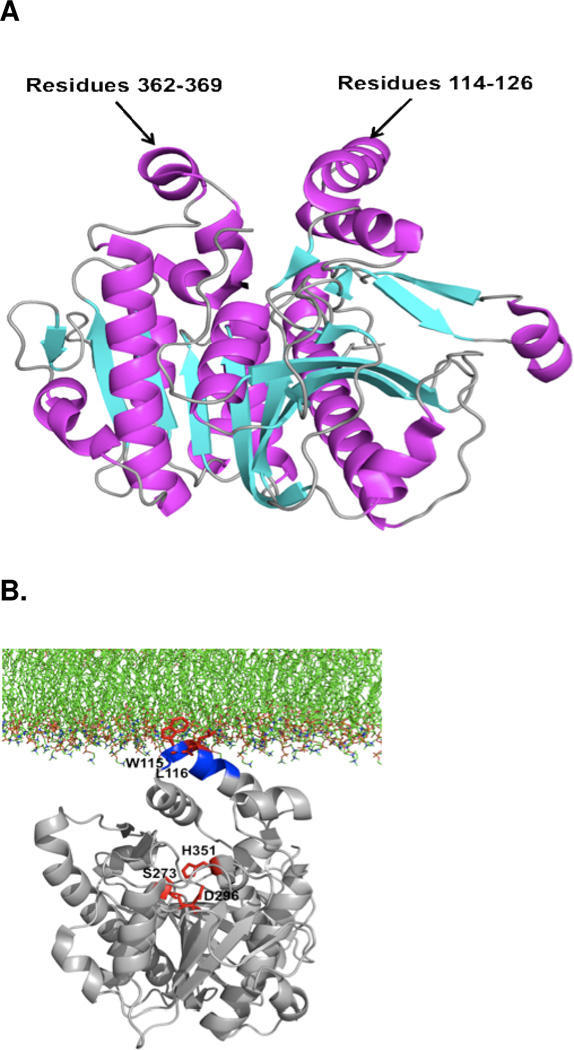
Figure 13.
A. The α/β hydrolase fold of the Group VIIA PLA2 (PAF-AH/Lp-PLA2) crystal structure (PDB entry:3D59). Helixes are shown in purple, β strands in green and loops in light gray. The predicted LDL (residues 114–126) and HDL(residues 362–369) binding surface are shown as indicated. B. Hypothetical model of Lp-PLA2 association with the DMPC lipid membrane surface. The Lp-PLA2 region implicated for Lp-PLA2/liposome association (residues 113–120), is shown in blue and the proposed key residues for Lp-PLA2/liposome association, Trp-115 and Leu-116 are shown in red, as are the catalytic triad residues, Ser-273, Asp-296 and His-351.446

