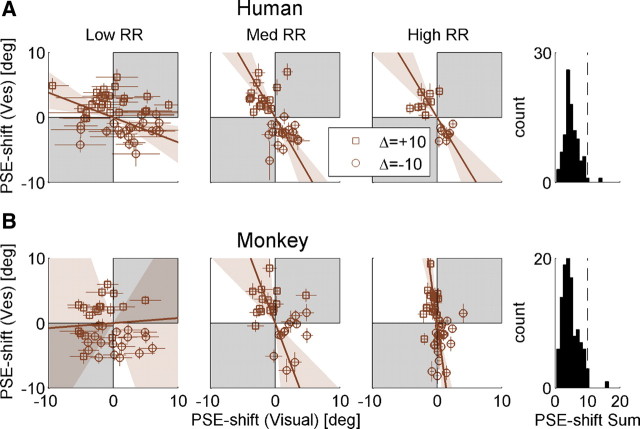
Figure 4.
Adaptation ratio. Population data are presented for both humans (A) and monkeys (B). Data in the left, middle, and right columns are sorted by low, medium, and high RR (ratio of visual to vestibular reliability), respectively. Each data point represents the adaptation observed in one experimental session, plotted as the shift in vestibular (Ves) PSE versus the shift in visual PSE. PSE shift was calculated as the difference between the pre-adaptation and post-adaptation PSEs. Error bars on the data points represent ±1 SD of the PSE shift (calculated by bootstrapping the psychometric curve data 2000 times). Squares and circles represent sessions with positive Δ (vestibular to the right of visual) and negative Δ (vice versa) discrepancies, respectively. The brown solid lines represent type II regressions of the data points, weighting each data point by its inverse (mean visual and vestibular) SD. The regression lines were constrained to pass through the origin. The brown shaded regions represent the 95% confidence bands of the regression lines (from 1000 bootstrapped datasets). Gray shading indicates regions where vestibular and visual cues shift in the same direction (unexpected by internal consistency theory). Histograms (far right column) indicate that the sum of the absolute visual and vestibular shifts (across all RRs) were primarily <10° (vertical dashed line). n = 45, 38, 17 (100 total) for human low, medium, and high RR, respectively. n = 36, 28, 44 (108 total) for monkey low, medium, and high RR, respectively.

