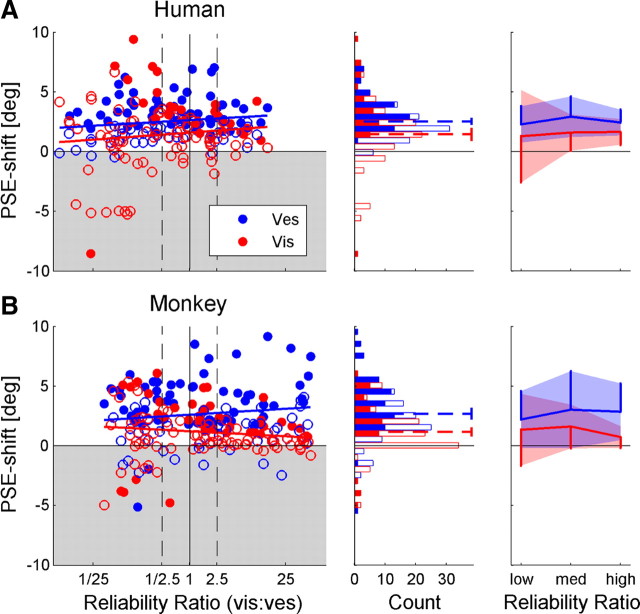
Figure 5.
Correct direction PSE shift. Human (A) and monkey (B) data were normalized by the direction of cue discrepancy, such that positive values represent a PSE shift in the expected direction, and negative values represent a PSE shift in the unexpected direction (gray shaded region). In the left column, the shift in the PSE for vestibular (blue) and visual (red) cues is plotted as a function of RR (ratio of visual/vestibular reliability). Filled data points represent significant shifts. The blue and red regression lines represent the linear fit of the visual and vestibular PSE shifts, respectively. Black dashed vertical lines mark the RRs used to sort the data by low, medium, and high RR. Blue and red histograms (middle column) display the vestibular and visual PSE shift distributions, respectively. Filled bars in the histograms represent significant PSE shifts. Dashed lines represent the mean PSE shifts, presented with 95% confidence intervals. Mean PSE shifts, grouped by low, medium, and high RR, are presented in the rightmost column. Shaded regions represent ±1 SD, and vertical lines represent 1 SD. n = 100 for the human data and n = 108 for the monkey data. Vis, Visual; Ves, vestibular.

