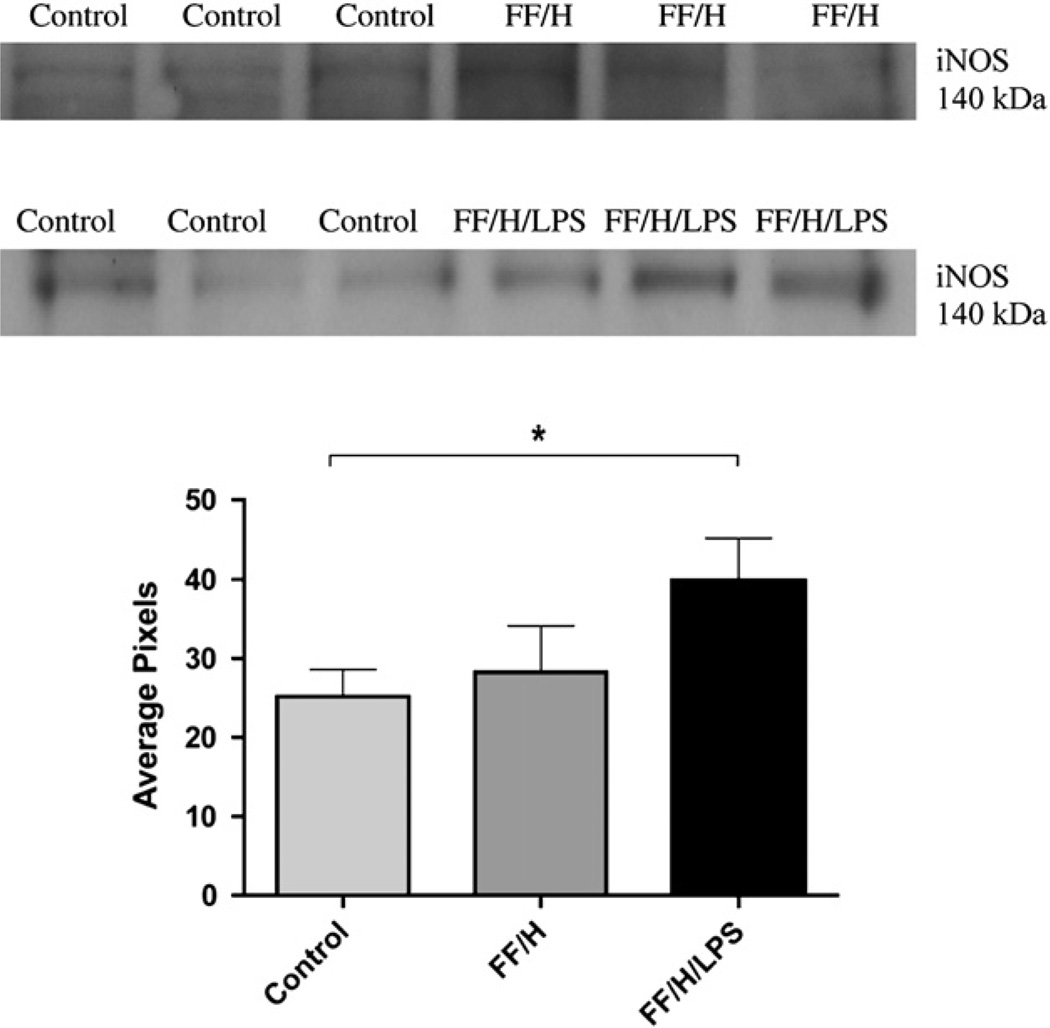
FIG. 5.
iNOS expression. Western blot band densities for iNOS in control versus formula fed/hypoxia (FF/H) pups and in control versus formula fed/hypoxia/LPS (FF/H/LPS) pups, molecular weight = 140 kDa. Densitometry data (mean pixels) are shown graphically, n = 6 for the control group and n = 3 for both FF/H and FF/H/LPS groups. Error bars represent standard error of the mean (SEM) and P ≤ 0.05 are indicated with an asterisk (*).

