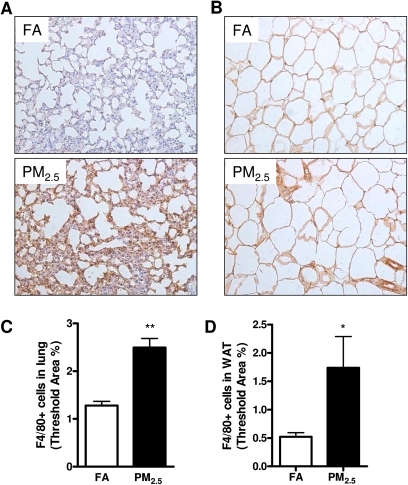
FIG. 3.
Effect of PM2.5 exposure on inflammatory response in the lung and WAT (epididymal) by immunohistochemistry. (A–D) Representative images (A–B) and statistical analysis (C–D) of immunohistochemistry for F4/80+ macrophages in the lung (A, C) and WAT (B, D). Original magnification, ×200. N = 11 in FA group; N = 9 in PM2.5 group. *p < 0.05 versus FA group, **p < 0.001 versus FA group.

