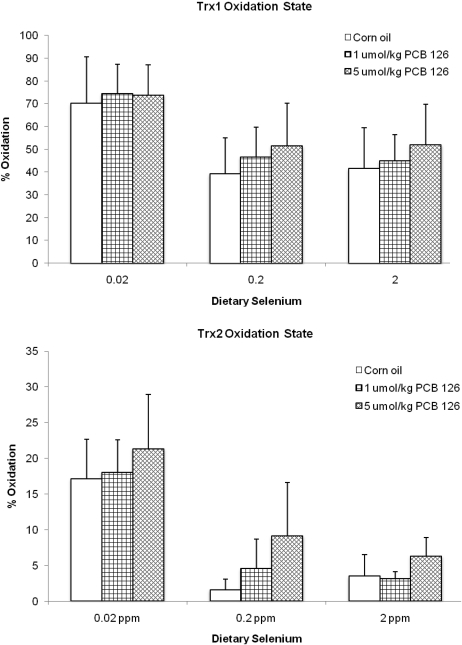
FIG. 4.
Trx1 (top) and Trx2 (bottom) oxidation state and significance of various comparisons (adjusted using Dunnett’s test). Results are expressed as mean ± SEM. Each group contained three animals. One-way ANOVA was used to examine the difference between each PCB 126 level and the corn oil treatment (*) and low/supplemented Se versus 0.2 ppm dietary Se (#); p < 0.05.

