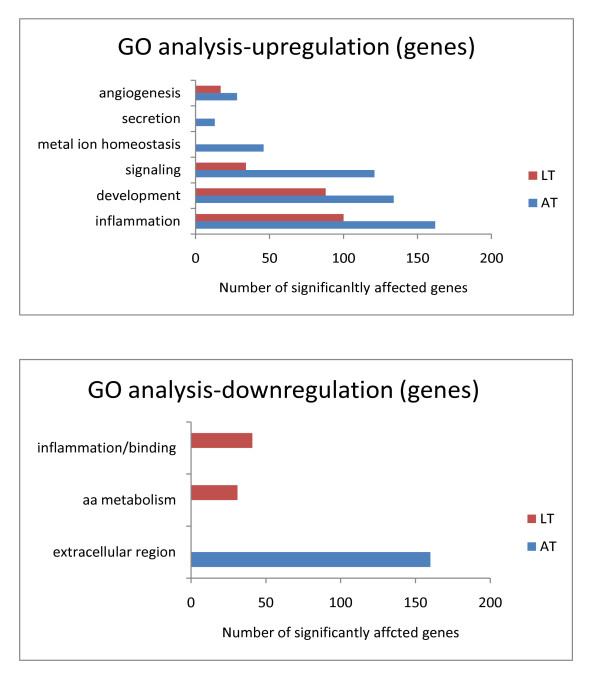
Figure 7.
Gene count analysis for the identified GO categories. Number of genes significantly upregulated and downregulated in adipose tissue (AT), n = 7, and liver tissue (LT), n = 5 within GO categories (angiogenesis, secretion, metal ion homeostasis, signaling, development, inflammation, amino acid (aa) metabolism, and extracellular region).

