
Figure 3.
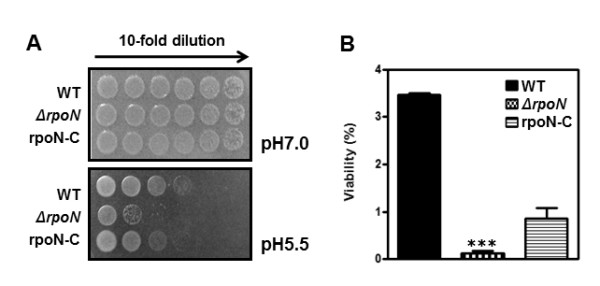
Effect of the rpoN mutation on acid stress resistance. (A) Growth of the rpoN mutant under different pH conditions was examined by dotting 10 μl of serially-diluted bacterial cultures. The results are representative of three independent experiments with similar results. (B) Viable cell counts on MH agar with different pH after 24 hr incubation. The % viability is expressed as mean ± standard deviation of three independent experiments. ***: P < 0.001; the significance of results was statistically analyzed by one-way ANOVA using Prism software (version 5.01; GraphPad Software Inc.).