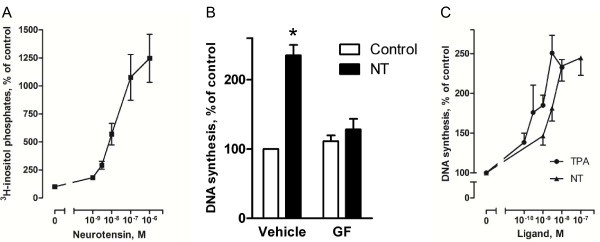
Figure 2.
Role of PKC in neurotensin-stimulated DNA synthesis in HCT116 cells. A, Dose-response curve for the effect of neurotensin (NT) on accumulation of [3 H] inositol phosphates in the presence of 15 mM LiCl. Cells were labeled with [3 H]-inositol for 24 hours before NT was added to quiescent cells at the concentrations indicated. The reaction was stopped after 30 minutes, and inositol phosphates were extracted and analyzed as described in Methods. Results are presented as per cent of control values ± S.E.M., n = 3. B, Effect of the PKC inhibitor, GF109203X (GF) on basal and NT-induced DNA synthesis. Quiescent cells were pretreated with 3.5 μM GF109203X for 30 min before stimulation with 1 μM NT. Based on dose-response curves for the effect of GF109203X on NT-induced DNA synthesis we found 3.5 μM to be the maximum concentration tolerated by our cells (data not shown). DNA synthesis was determined by [3 H]thymidine incorporation as described in the legend of figure 1. Results are presented as per cent of control values of seven independent experiments. Error bars indicate S.E.M. * Significantly different from control (p < 0.05). C, Dose-response curves for the effects of NT or TPA on DNA synthesis. Quiescent cells were treated with the respective agonists in the concentrations indicated. DNA synthesis was determined by [3 H]thymidine incorporation as described in the legend of figure 1. The results are presented as per cent of control values ± S.E.M. of six independent experiments.

