Fig. 3.
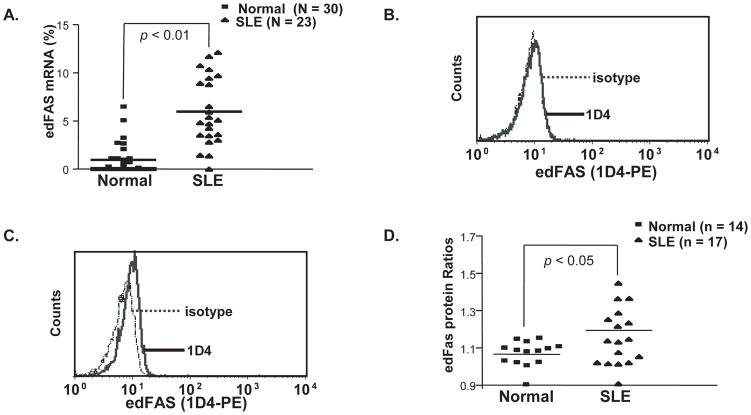
Increased FAS editing mutation products in SLE patients. A). Quantification of edFAS mRNA in SLE patients and normal controls. The percentages of edFAS mRNA relative to the total FAS mRNA were calculated as described in “Materials and Methods”. The percentages of edFAS mRNA were significantly increased in SLE patient groups compared to normal control group (P < 0.01). B). The edFAS protein was undetectable in CD3+ T cells from a normal donor in intracellular flow cytometry using anti edFAS mAb (1D4). C). The edFAS was detected in CD3+ T cells from an SLE patient. D). Different edFAS expression in CD3+ T cells between SLE patients and normal controls. The edFAS protein ratios were calculated as the MFI (mean fluorescence intensity) of anti edFAS mAb (1D4) over the MFI of the mIgG1 isotype control. The edFAS protein production was significantly enhanced in SLE patient groups compared to normal control group (P < 0.05).

