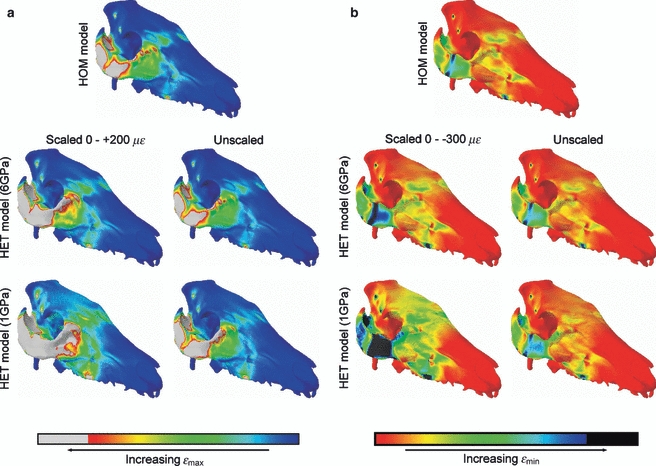
Fig. 7.

The effects of varying material properties on contours of εmax (A) and εmin (B). When the contours are scaled to the same values, values above +200 με (A) and below −300 με (B) are displayed as white and black areas, respectively. Higher strain magnitudes are evident in the less stiff HET models, but when left unscaled it can be seen that the contour patterns are barely affected.
