
Fig. 10.
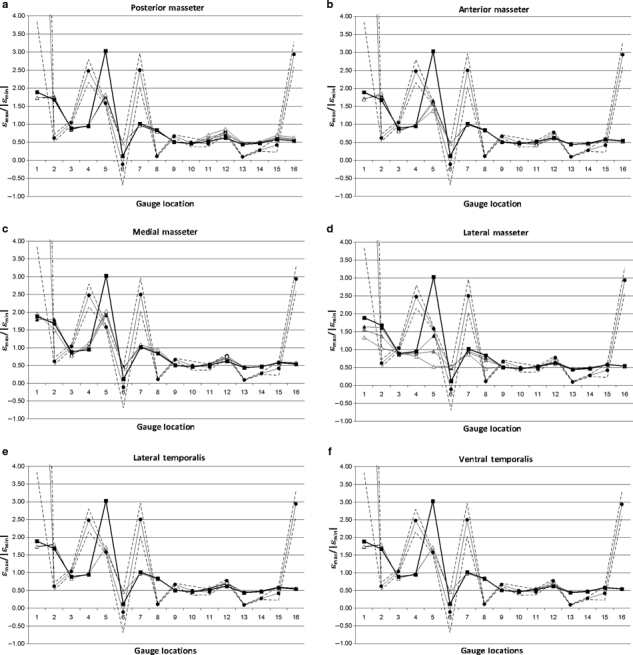
Sensitivity of the model strain ratios to changes in loading to the masseter (a–d) and the temporalis (e, f) in the (a) posterior; (b) anterior; (c) medial; (d, e) lateral; and (f) ventral directions. Circular markers show the experimental results and dashed lines indicate 2 SE of the mean. Square markers show the original HOM model configuration. Triangular markers show the LOAD models modified by 2.5 ° (black), 5 ° (grey) and 10 ° (white) in the indicated direction. G1 and G6 gave unstable experimental results, and should be disregarded.