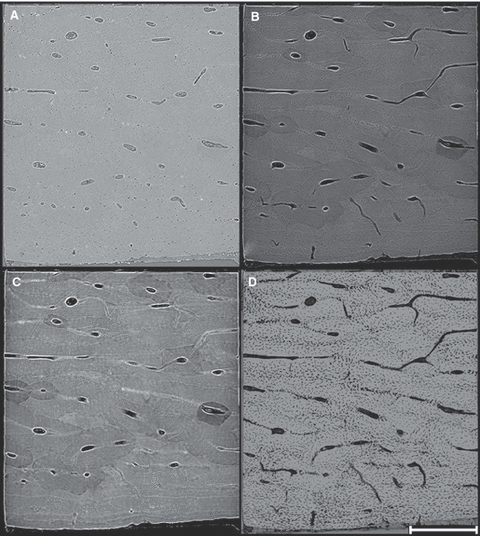
Fig. 2.

Representative images from the posterior block located at the periosteal surface of the linea aspera (see Fig. 1). (A) Single SR micro-CT cross-sectional image (1.4 μm isotropic voxels). (B) Average projection through 100 μm. (C) Median projection through 100 μm. (D) Minimum projection through 100 μm, highlighting pores. Scale bar at bottom right is 500 μm long.
