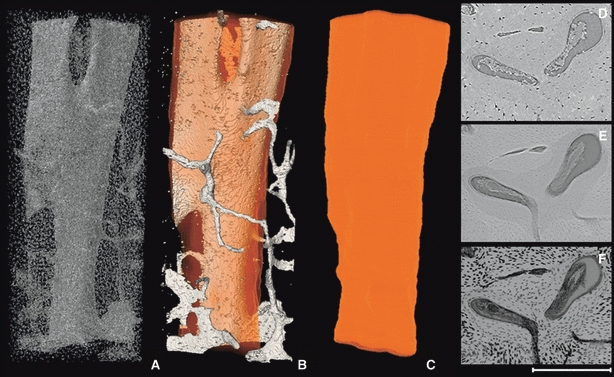
Fig. 6.

Representative 3D (A–C) and 2D (D–F) images of a branched osteon medial periosteal surface (Fig. 1). The porous structures alone (A), vascular porosity with the superimposed osteon outline (B) and finally the osteon outline alone (C) are portrayed in 3D. The 2D images are (D) a raw SR micro-CT image; (E) an average projection through 100 μm; and (F) a minimum projection through 100 μm (F). The 2D images (all same location) were produced from the most superior slices used to render the 3D images. The total length of the 3D render is 1.7 mm. Scale bar at bottom right is 250 μm long.
