
Fig. 8.
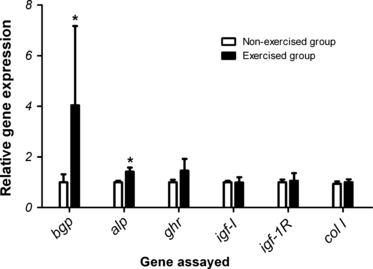
Gene expression of osteocalcin (bgp), alkaline phosphatase (alp), growth hormone receptor (ghr), insulin growth factor I (igf-I), insulin growth factor I receptor (igf-1R) and collagen type 1 alpha 2 (col I) in vertebral bone of exercised (black bars) and non-exercised (white bars) fish. The genes are listed on the x-axis, while the y-axis indicates the relative abundance of the transcripts in relation to the normalization factor elongation factor1α. Data are presented as means ± SEM Significant gene expression differences between the two groups are indicated by an asterisk (*P< 0.05).