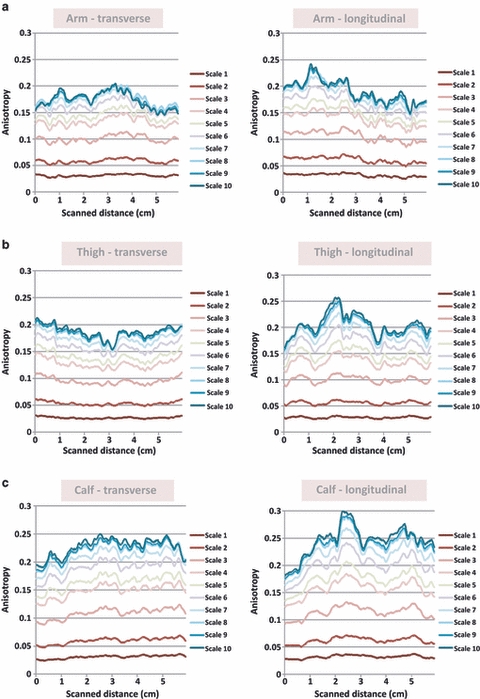
Fig. 6.

(a–c) Spatial anisotropy in ultrasound sweeps. Spatial anisotropy across a 6-cm sweep is graphed here for spatial scales 1–10 for transverse (left) and longitudinal (right) orientations. A representative sample from the arm (a), thigh (b) and calf (c) is shown.
