
Fig. 4.
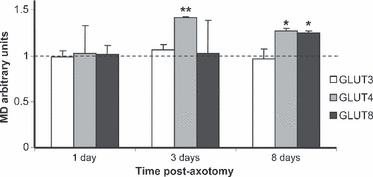
Quantification of the mean density (MD) of GLUT3, GLUT4 and GLUT8 immunoreactivity in the facial nucleus. The MD of the control nucleus was taken as 1, and the density of the immunoreactivity in the lesioned nuclei represents the variation in relation to the contralateral non-injured nuclei. *P< 0.05; **P< 0.01.