
Figure 1.
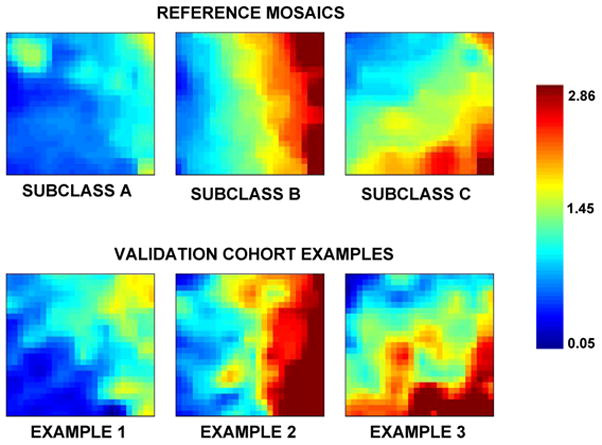
GEDI-generated reference mosaics (top panel) and examples of GEDI-generated individual patient mosaics from the validation cohort (bottom panel). The reference mosaics are derived from the previously published derivation cohort (Refs. 6 and 7) and represent the mean expression values for patients in the respective subclasses. Both the reference mosaics and the individual validation cohort examples depict the expression levels of the same 100 class-defining genes. The color bar on the right provides the relative gene expression based on the respective color intensities.