
Figure 3.
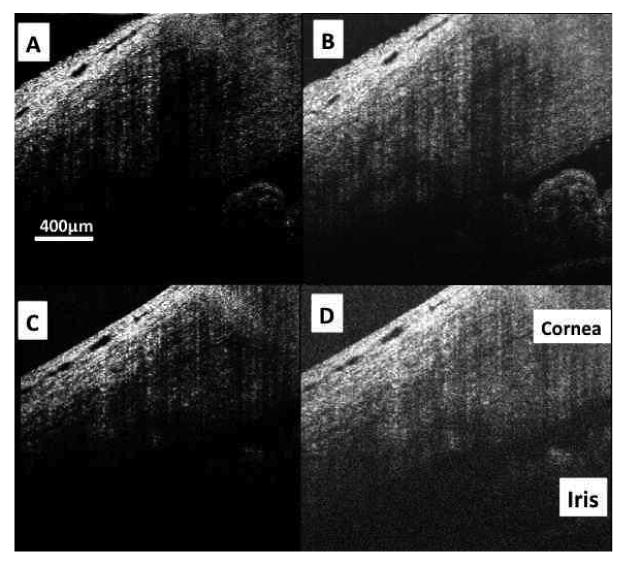
Spectral domain optical coherence tomography images would normally be displayed with a low level of brightness. (A) In the case of highly averaged image data (700 A-scans in this frame; each A-scan the average of 18 sequentially acquired A-scans), brightness can be increased (B) allowing visualization of deep low signal structures such as the iris, angle, trabecular meshwork, and endothelial/Descemet's complex without compromising due to visible noise. SDOCT images obtained without averaging (512 A-scans, each presented without averaging) and displayed with a low level of brightness (C) have an appearance similar to those obtained with averaging at the same noise suppression level. But, increasing brightness reveals the noise masking the deep layers where the signal is low (D).