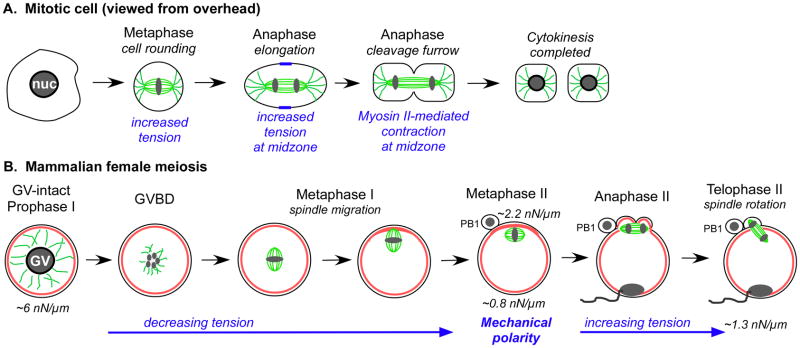
Figure 2. Comparisons of changes occurring during mitosis and mammalian female meiosis.
Schematic diagrams showing cell shape and mechanics changes occurring in a mitotic cell (A) and in a mouse oocyte going through meiosis (B), illustrating the changes that occur through these transitions. Panel A depicts the basic morphological changes and associated mechanical events of a mitotic cell, while Panel B diagram depicts the basic morphological events and mechanical transitions that occur during mouse female meiosis. Tubulin is shown in green, and actin is red.

