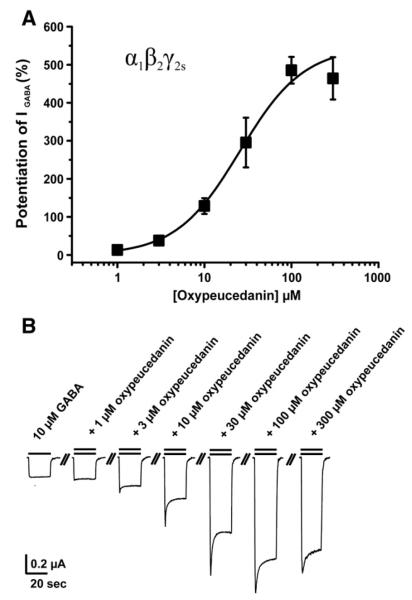
Fig. 4.
(A) Concentration–response curve for IGABA enhancement by oxypeucedanin (OPD, EC50=26±8 μM, nH=1.2±0.1, n=4) in oocytes expressing α1β2γ2S GABAA receptors. (B) Representative currents through α1β2γ2S GABAA receptors in the presence of GABA (10 μM, single bar, control) and currents recorded during co-application of GABA (10 μM) and 1, 3, 10, 30, 100 and 300 μM of oxypeucedanin (double bar).

