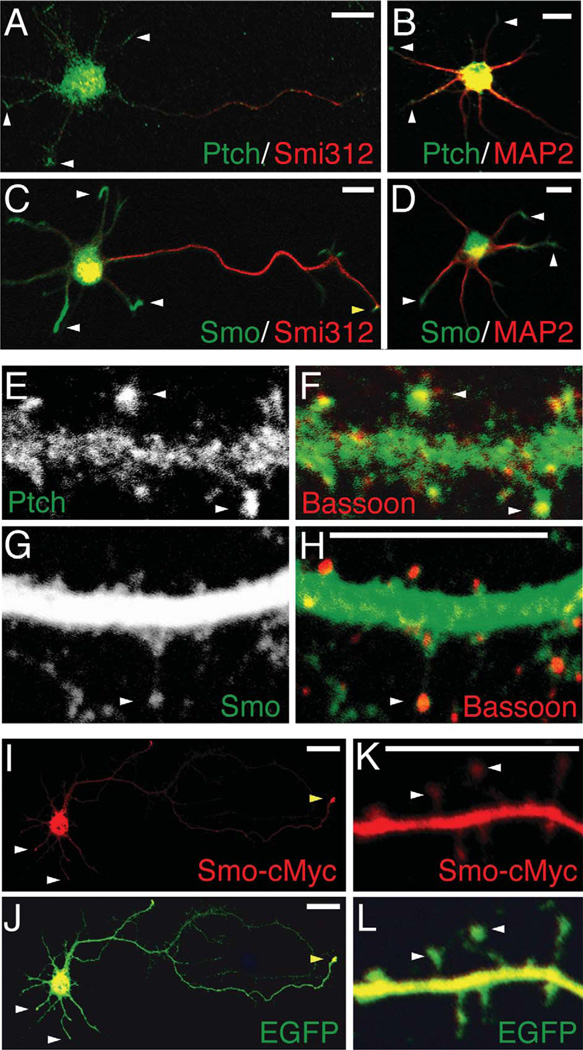
Figure 2.
Distribution of Ptch and Smo in cultured hippocampal neurons. A–D: Immunofluorescence labeling of Ptch and Smo in young hippocampal neurons (2 div). Double labeling of Ptch (green) with the axonal marker Smi312 (red) or the dendritic marker MAP2 (red) shows that, in addition to the soma, Ptch is detected in the tips of dendrites (white arrowheads). Double labeling of Smo (green) with Smi312 or MAP2 shows bright Smo labeling in dendritic tips (white arrowheads) and faint Smo labeling in axonal tips (yellow arrowhead). E–H: Immunofluorescence labeling of Ptch and Smo in mature hippocampal neurons (20 div). White arrowheads in E and F indicate Ptch labeling in spine heads, paired with the presynaptic marker bassoon (red). G and H show substantially more Smo labeling in dendrites than in spine heads (arrowhead). I,J: A cultured hippocampal neuron (2 div) co-expressing Smo-cMyc and EGFP. An antibody to cMyc (red) reveals Smo-cMyc in dendritic (white arrowheads) and axonal (yellow arrowhead) tips. K,L: A cultured hippocampal neuron (20 div) expressing Smo-cMyc. The ectopically expressed Smo-cMyc is more intense in dendrites and weaker, but not absent, in spine heads (arrowheads). Scale bar = 10 mm in A–D; 5 mm in H (applies to E–H), and K (applies to K,L); 20 mm in I,J.

