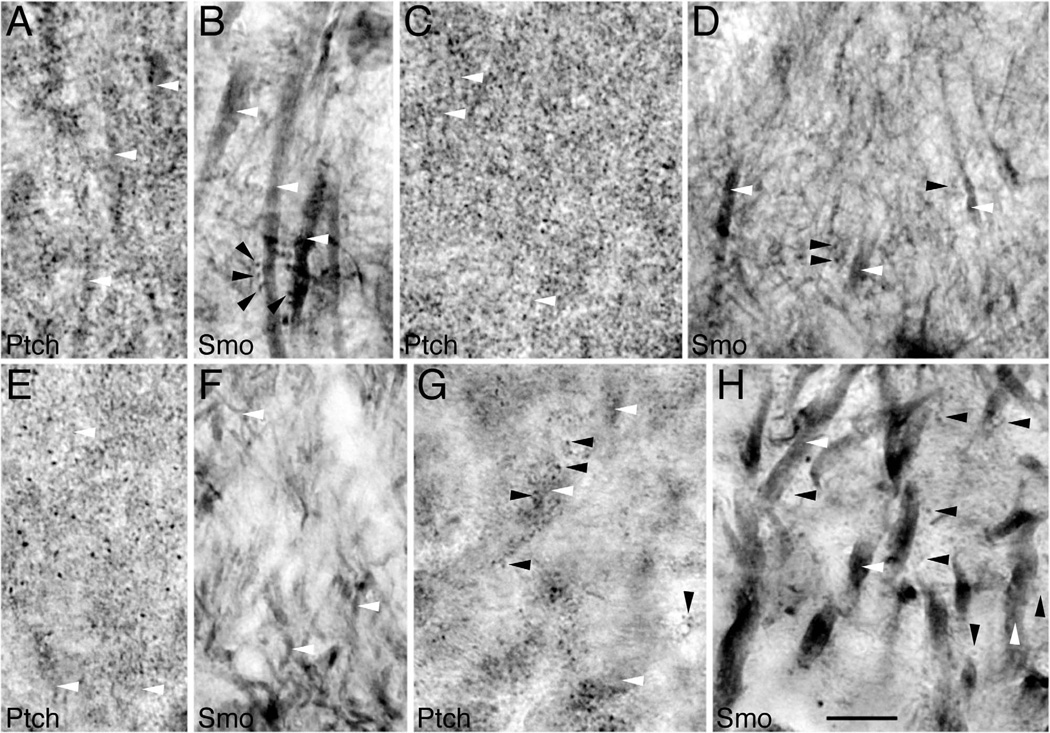
Figure 4.
Cellular distribution of Ptch and Smo in the hippocampus of adult rats using immunoperoxidase/DAB light microscopy. A,B: The CA1 stratum radiatum. C,D: The CA1 stratum oriens. E,F: The molecular layer of the dentate gyrus. G,H: The CA3 stratum lucidum. In all regions, intensely labeled Ptch puncta (black arrowheads) surround lightly labeled dendrites (white arrowheads). In contrast, Smo labels dendrites (white arrowheads) more intensely than puncta (black arrowheads). Scale bar = 10 mm in H (applies to a–H).

