Figure 5.
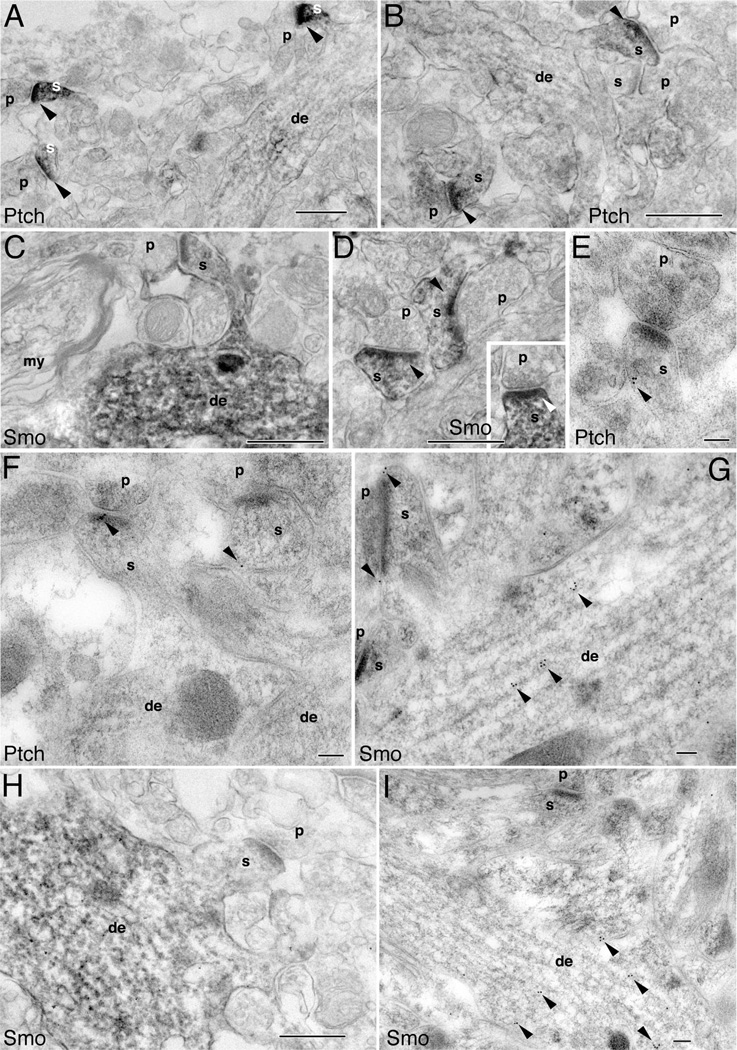
Postsynaptic localization of Ptch and Smo in mature hippocampal neurons. Ptch and Smo labeling in the CA1 stratum radiatum (A,B,E,F,H,I), CA3 stratum radiatum (C,G), and the CA1 stratum oriens (D) of the adult hippocampus. A–D,H are immunoperoxidase/DAB and E–G,I are immunogold labeling. A,B: Intense Ptch labeling (arrowheads) in spines (s), with little or no labeling in dendrites (de) or the presynaptic terminals (p). C: Example of a Smo distribution pattern whereby Smo labeling is prominent in dendrites. Also note that the presynaptic terminal (p) and a nearby myelinated axon (my) do not have Smo labeling. D,inset: Examples of Smo-containing spines synapse with Smo-absent presynaptic terminals. E,F: Ptch immunogold particles within spines (arrowheads). G: Smo immunogold particles in the spine as well as in the dendrite (arrowheads). H: Another example of positive Smo immunoperoxidase labeling in a dendrite. I: Another example of Smo immunogold labeling (arrowheads) in a dendrite. Scale bar = 500 nm in A–D,H; 100 nm in E–G,I.

