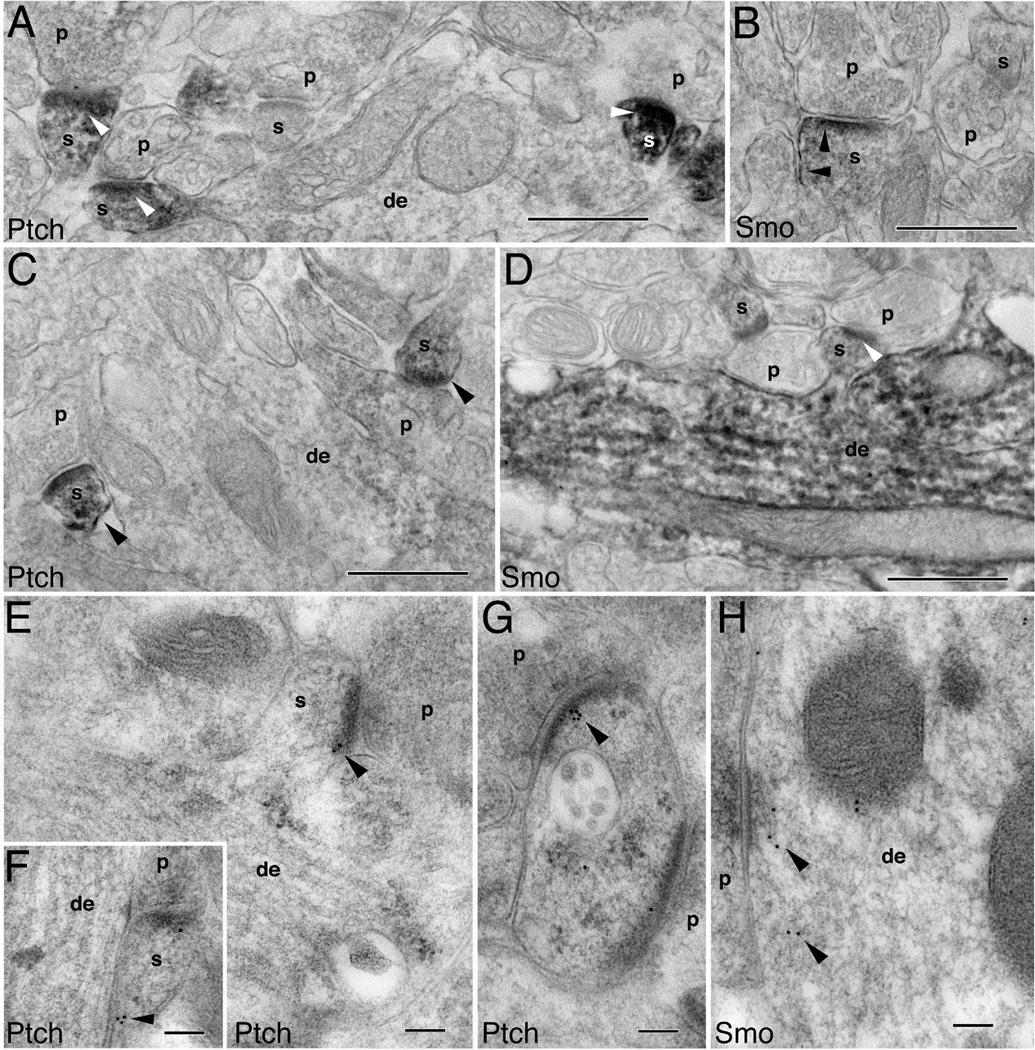
Figure 6.
Postsynaptic distribution of Ptch and Smo in the molecular layer of the dentate gyrus. A–D are immunoperoxidase/DAB labeling and E–H are immunogold labeling. A,C: Ptch labeling (arrowheads) is high in spines (s) and low in dendrites (de). B,D: Smo labeling is found in spines (arrowheads in B) but is prominent in dendrites (D). E–G: Examples of Ptch immunogold labeling in spines (arrowheads). H: Example of Smo immunogold labeling in a dendrite (arrowheads). Scale bar = 500 nm in A–D; 100 nm in E–H.

