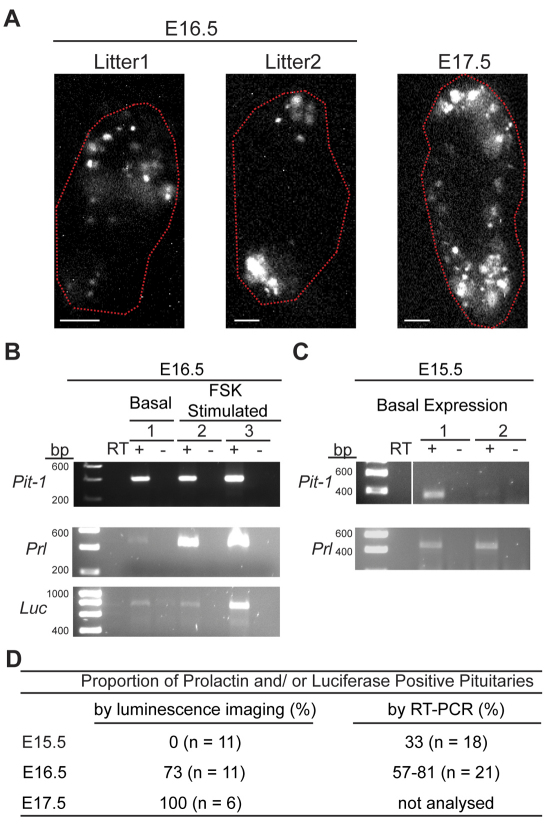
Fig. 2.
Onset of prolactin gene expression in developing pituitary. (A) Organisation of lactotroph cells in E16.5 and E17.5 pituitaries. The position of pituitary tissue, defined from brightfield images, is circled in red. Scale bars: 100 μm. Two E17.5 litters (12 pituitaries) and four E16.5 litters (28 pituitaries) were imaged. Images shown are from the start of organ culture. (B) RT-PCR detection of Pit-1, prolactin (Prl) and luciferase (Luc) from luminescent E16.5 pituitaries from litter 1 shown in A. Animal 1 was imaged for luminescence in basal culture medium (unsupplemented BSA medium) and then transferred into RNAlater solution within 6 hours. Animals 2 and 3 were imaged for 24 hours in rat serum medium followed by 1 μm forskolin (FSK) activation for 18 hours before transfer into RNAlater solution. Controls without reverse transcriptase (RT) are also shown. (C) RT-PCR for Pit-1 and Prl expression in undissected E15.5 pituitaries. Two pituitaries with prolactin expression are shown from 18 pituitaries analysed from two independent litters. (D) Table showing the proportion of pituitaries expressing prolactin and/or luciferase from E15.5 to E17.5 animals.

