
Figure 1.
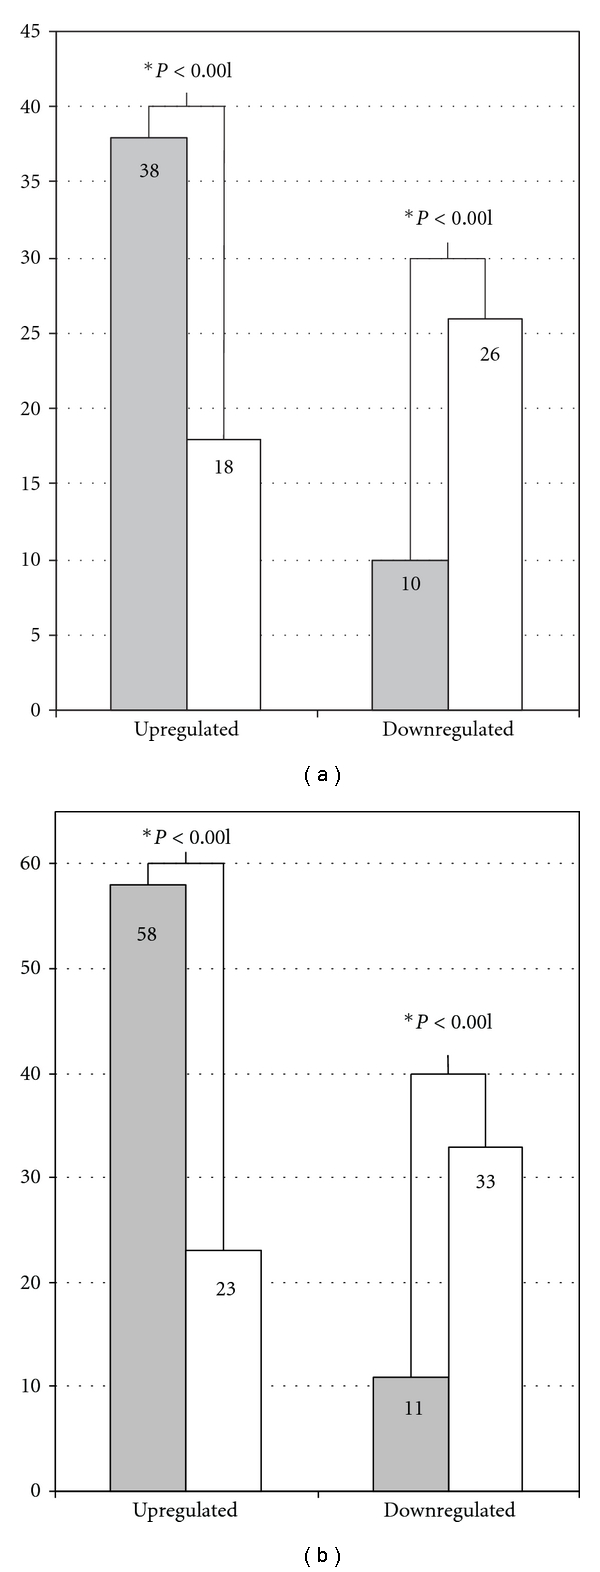
Differentially expressed inflammation and macrophage genes in Ewing sarcoma patient samples. (a) Differentially expressed inflammation genes and (b) macrophage genes by comparing Ewing patient samples (n = 44) to cell lines (n = 11). On Y-axis, the detected number of inflammatory genes and macrophage genes are marked with grey and the number of expected genes with white bar. The level of statistical significance is marked below the bars and a figure with ∗ indicates a statistically significant result.