
Figure 1.
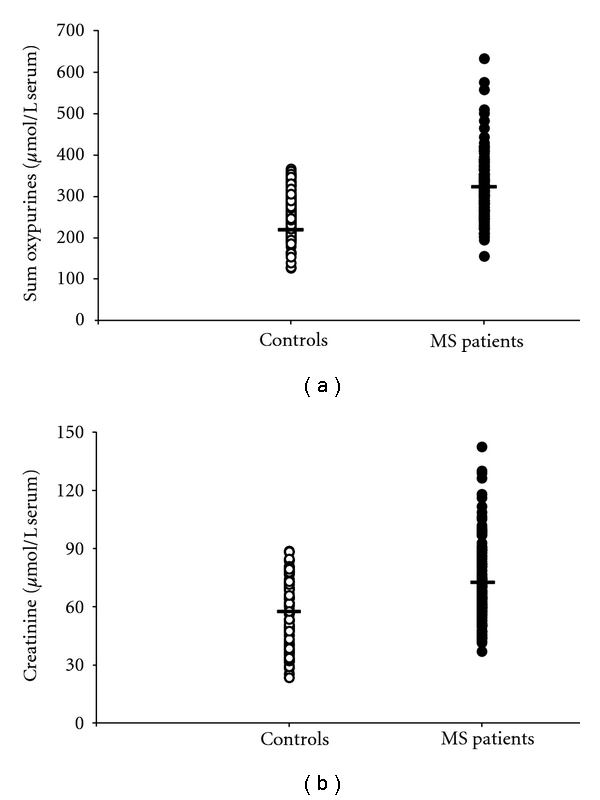
Scatter plot showing the sum of oxypurines (uric acid + hypoxanthine + xanthine) (a) and creatinine (b) recorded in serum of 163 healthy controls and 170 MS patients. Horizontal bars indicate the mean values calculated in the two groups.
Official websites use .gov
A
.gov website belongs to an official
government organization in the United States.
Secure .gov websites use HTTPS
A lock (
) or https:// means you've safely
connected to the .gov website. Share sensitive
information only on official, secure websites.
Scatter plot showing the sum of oxypurines (uric acid + hypoxanthine + xanthine) (a) and creatinine (b) recorded in serum of 163 healthy controls and 170 MS patients. Horizontal bars indicate the mean values calculated in the two groups.