
Figure 5.
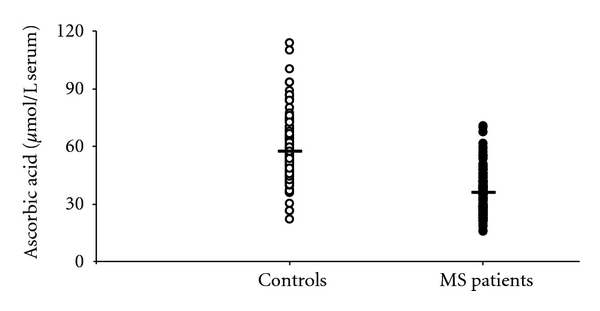
Scatter plot showing the concentration of ascorbic acid recorded in serum 163 healthy controls and 170 MS patients. Horizontal bars indicate the mean values calculated in the two groups.
Official websites use .gov
A
.gov website belongs to an official
government organization in the United States.
Secure .gov websites use HTTPS
A lock (
) or https:// means you've safely
connected to the .gov website. Share sensitive
information only on official, secure websites.
Scatter plot showing the concentration of ascorbic acid recorded in serum 163 healthy controls and 170 MS patients. Horizontal bars indicate the mean values calculated in the two groups.