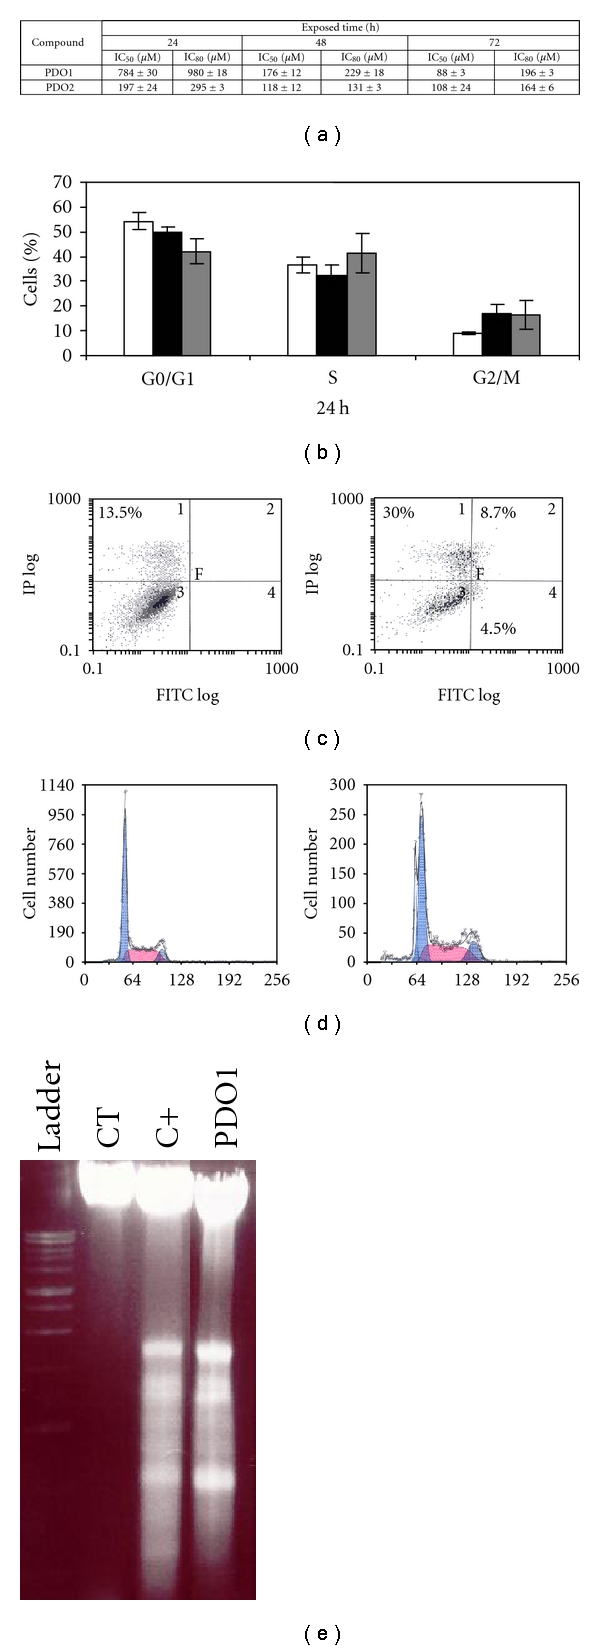
Figure 4.

(a) IC50 and IC80 of PDO1 and PDO2 on Caco-2 cells after 24, 48, and 72 h incubation. (b) Percentage of distribution in different phases of cell cycle of untreated (□) and treated Caco-2 cells after 24 h with PDO1 at respective IC50 (■) and IC80 (■). (c) Percentage of early and late apoptotic and necrotic cells assessed by flow cytometry analysis of Annexin V-FITC staining and PI accumulation after exposure of Caco-2 cells to PDO1 at respective IC50 and IC80 after 24 h of incubation. (d) Apoptotic peaks detected by flow cytometry in treated Caco-2 cells after 24 h incubation with untreated (left) and PDO1-treated (right) at respective IC80. (e) Agarose gel electrophoresis analysis of DNA from Caco-2. Cells were incubated in the absence of substances (CT) or treated with PDO1 at IC50 or staurosporine (10 μM) (C+) for 24 h.
