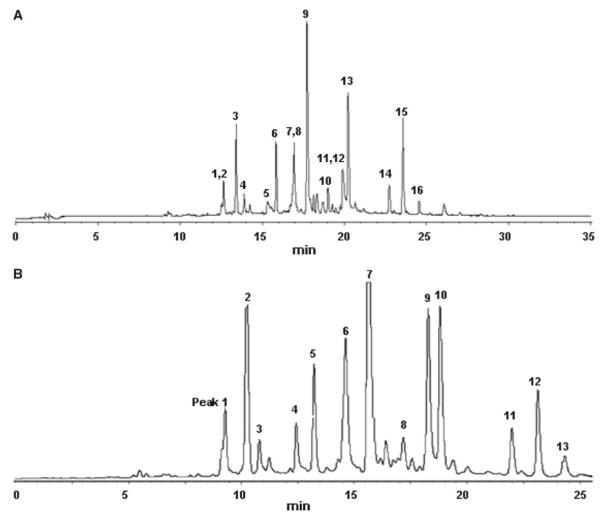
Fig. 3.
a The optimized HPLC separation for LC–PDA–TOFMS analysis of the EtOAc extract is shown. Peak labeling corresponds to compounds 1–16. 200 μg extract in 20 μL DMSO were injected. The HPLC trace was recorded at 254 nm. b The chromatogram (254 nm) of the optimized, semi-preparative HPLC separation of the EtOAc extract (80 mg in 200 μL DMSO) is shown. Peaks 1–13 were collected for microprobe NMR and further purified if required

