Figure 1.

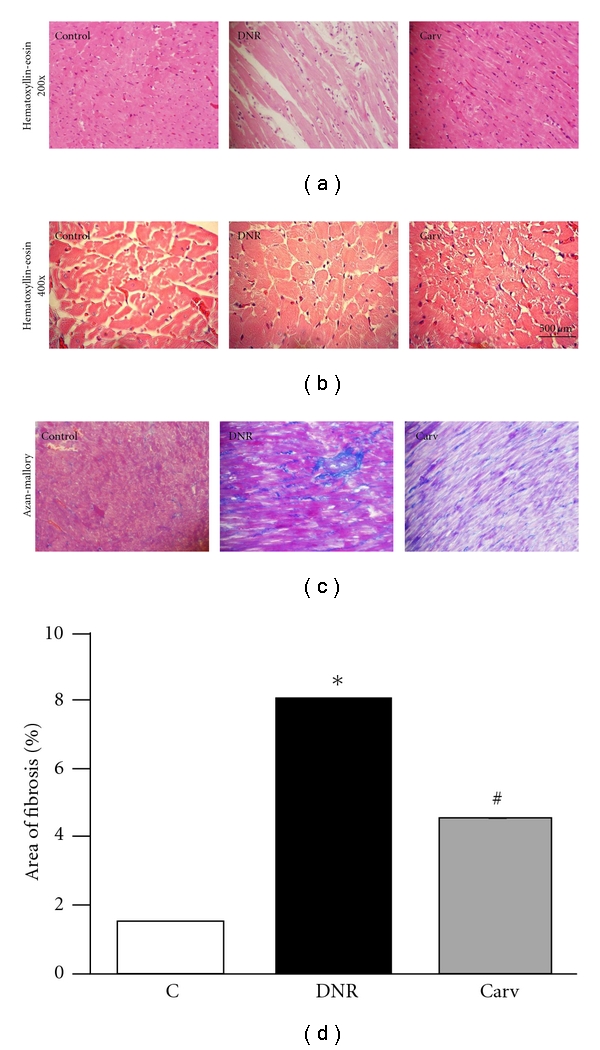
(a) Hematoxylin and eosin staining of the cross-sectional tissue slices of hearts depicting interstitial edema, vacuolization, and degeneration of cardiac fibers (X200). (b) Hematoxylin and eosin staining of the cross-sectional tissue slices of hearts depicting cardiac hypertrophy (X400), (c) Azan-Mallory staining for fibrosis of the cross-sectional tissue slices of hearts. Fibrosis is indicated by the blue area as opposed to the red myocardium (X200). (d) Bar graph showing % fibrosis in each experimental group. Each bar represents mean ± S.E.M. Group control (C) age-matched normal rats; group DNR, DNR-treated rats administered with vehicle; group Carv, DNR-treated rats administered with carvedilol (30 mg/kg/day). *P < .05 versus group Control; # P < .05 versus group DNR.
