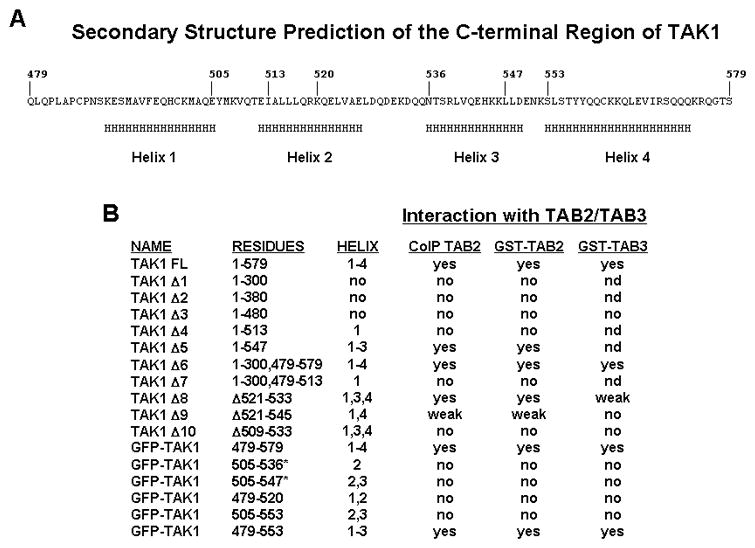
FIGURE 7. Predicted secondary structure of TAK1-C100 and summary of the interaction of TAK1 mutants with TAB2 and TAB3.

A, Schematic diagram of the C-terminal 100 residues of TAK1. A secondary structure prediction program (46) was used on the last 100 residues of TAK1 and regions of alpha-helical structure (H) were assigned based upon a confidence level of greater that 80%. B, Summary of the interaction between TAK1 and TAB2/TAB3 based upon results depicted in Figures 1 and 2. Yes, positive interaction; no, no interaction; weak, weak interaction; nd, not determined; *, data not shown.
