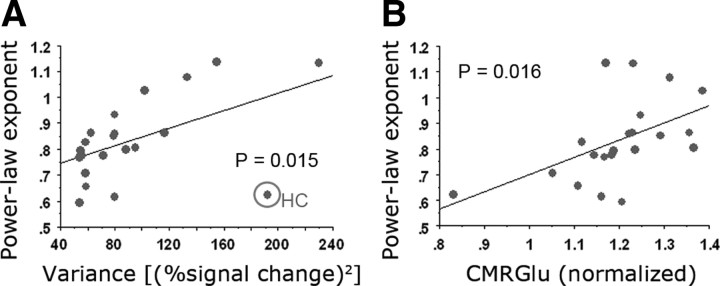
Figure 3.
fMRI power-law exponent correlates with variance and CMRGlu. A, A scatter plot showing the values of power-law exponent and variance of the fMRI signal for each of 21 brain regions (correlation, r = 0.517, p = 0.015). The best-fit linear-regression line is shown. The outlier indicated by circle is the hippocampal formation (HC), with a very high variance but small power-law exponent. The r and p values were computed including the hippocampal formation. B, A scatter plot showing fMRI signal power-law exponent and regional CMRGlu value for each of 21 brain regions (r = 0.514, p = 0.016).

