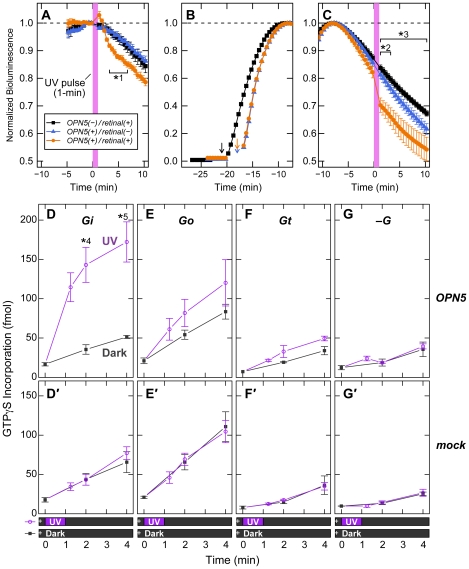
Figure 2. UV-dependent activation of Gi-type G protein by OPN5.
(A–C) UV-induced cAMP reduction in OPN5-expressing HEK293S cells. The HEK293S-mOPN5#11 cells [OPN5(+)] or the wild-type HEK293S cells [OPN5(–)] were introduced with the expression vector of GloSensor protein, a luciferase derivative whose activity reflects cytosolic cAMP levels, and then the cells were cultured in the medium supplemented with 1 µM of 11-cis-retinal [retinal(+)] or without retinal [retinal(–)]. The bioluminescence of the cell culture was continuously monitored in the presence of luciferin. (A) The cells were first kept in the dark until their bioluminescence became stable, and then the cells were irradiated with 379-nm light for 1 min (indicated with violet). The bioluminescence values were normalized by those just before the irradiation for each dish. The data are represented by the mean ± SEM (n = 3) for OPN5(–)/retinal(+) and OPN5(+)/retinal(+), or by the mean ± SD (n = 2) for OPN5(+)/retinal(–). Statistical significance for the difference between the OPN5(+)/retinal(+) and OPN5(–)/retinal(+) data is shown as the asterisk (*1, p<0.05 by two-tailed Student's t-test). (B, C) Prior to the UV irradiation, the cells were stimulated with 10 µM of forskolin to increase the cAMP level. Shown in the panel B are the representative inductions in bioluminescence by forskolin, which was supplied into the cell culture at the indicated time points (arrows). Eight minutes after the bioluminescence peaking at the maximal values (C), the cells were irradiated with 379-nm light for 1 min (indicated with violet). The bioluminescence values were normalized by the maximal value for each dish. The UV-dependent reduction required both OPN5 and 11-cis-retinal. In the panel C, statistical significance of the OPN5(+)/retinal(+) data is shown as the asterisks (*2, p<0.05 against the OPN5(+)/retinal(–) data; *3, p<0.05 against the OPN5(–)/retinal(+) data) by one-way ANOVA with Tukey's post hoc test. (D–G, D′–G′) The UV-evoked activations of G proteins by OPN5 were measured by GTPγS-binding assays using the membrane fraction of the HEK293T/17 cells transfected with the expression construct for mouse OPN5 (D–G) or mock-transfected (D′–G′). Mixture of the membrane and the purified Gi (D, D′), Go (E, E′), Gt (F, F′), or no G protein (G, G′) was supplied with [35S] GTPγS (indicated by a cross in the bars under the horizontal axes) and then irradiated with 379-nm light (UV) or no light (Dark) for 1 min. The incorporated GTPγS was quantified at each time point after the irradiation and subjected to statistical analyses by two-tailed Student's t-test (*4, p = 0.0095; *5, p = 0.041). UV-dependent activation of Gi by OPN5 was detected in the panel D, whereas Go (E) and Gt (F) showed only slight tendencies of UV-dependent activation by OPN5, however, with no statistical significance at any time point. In the control experiments without OPN5 (mock), no significant difference in GTPγS incorporation was detected between UV and Dark (D′–G′). The data were represented by the mean ± SEM (n = 3; D–G, D′-F′) or by the mean ± SD (n = 2; G′).

